Katherine SchaefferJanuary 21, 2025
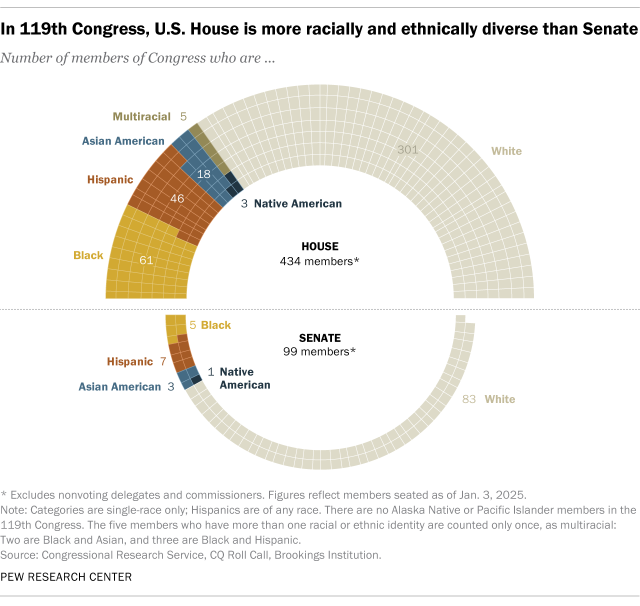
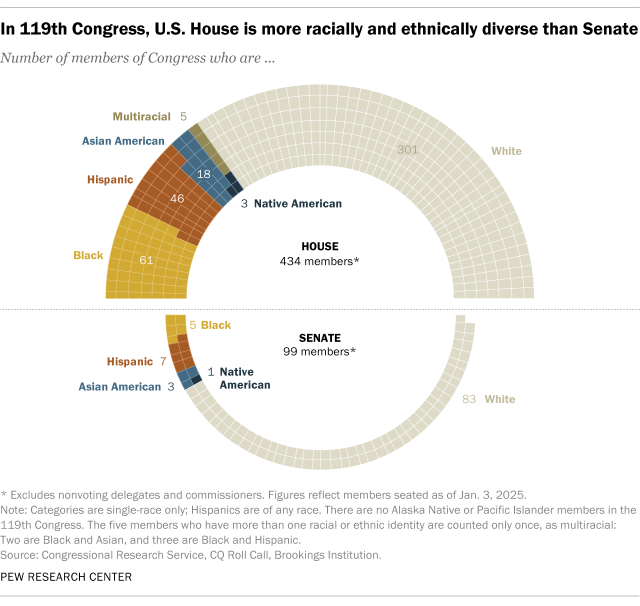
Just over a quarter (26%) of voting members in the U.S. Congress identify as a race or ethnicity other than non-Hispanic White, making the 119th Congress the most racially and ethnically diverse to date. In continuation of a long-running trend, this is the eighth Congress to break the record set by the one before it.
Overall, 139 of today’s senators and representatives identify as Black, Hispanic, Asian American or Native American, according to a Pew Research Center analysis of data from CQ Roll Call and the Congressional Research Service. This number has nearly doubled in the two decades since the 109th Congress of 2005-07, which had 73 members belonging to racial or ethnic minorities.
This analysis reflects the 533 voting members of the 119th Congress as of Jan. 3, 2025, the first day of the new Congress. Our count of Hispanic lawmakers excludes at least three members of Congress who identify as Portuguese American.
The vast majority (84%) of racial and ethnic minority members in the new Congress are Democrats, while 16% are Republicans. This gap is slightly wider than in the previous Congress, when 80% of non-White lawmakers were Democrats and 20% were Republicans.
The House of Representatives
In all, 28% of House members are Black, Hispanic, Asian or Native American, the same as in the previous Congress. No current voting members are Alaska Native, Native Hawaiian or Pacific Islander.
The 119th House includes five multiracial representatives – all Democrats. These five are counted in each racial or ethnic group they identify with, but once in our overall total:
- Florida Rep. Maxwell Alejandro Frost and New York Reps. Ritchie Torres and Adriano Espallait identify as Black and Hispanic.
- Virginia Rep. Bobby Scott and Washington Rep. Marilyn Strickland are Black and Asian. Scott is the first lawmaker of Filipino descent in the U.S. Congress. Strickland is the first Black lawmaker to represent her state at the federal level, as well as one of the first Korean American women elected to Congress.
In the new House, 85% of minority representatives are Democrats while 15% are Republicans. In the chamber overall, the partisan split is about 50-50.
The House also includes 16 newly elected members – including 15 Democrats and one Republican – who are racial or ethnic minorities. This is a decrease from the last Congress, when 27 newly elected members – 19 Democrats and eight Republicans – were racial or ethnic minorities.
In addition to voting members of the House, there are six nonvoting delegates who represent U.S. territories and the District of Columbia. Among these nonvoting delegates, two are Black, two are Asian/Pacific Islander, one is Hispanic and one identifies as both Hispanic and Asian/Pacific Islander.
The Senate
In the upper chamber of Congress, 16 senators are racial or ethnic minorities, an increase from 12 in the 118th Congress. Seven senators are Hispanic, five are Black, three are Asian and one is Native American.
Two Black women will serve simultaneously in the Senate for the first time in history: Democrats Angela Alsobrooks of Maryland and Lisa Blunt Rochester of Delaware are the first Black senators to represent their respective states in the chamber.
Three-quarters of the senators who are racial or ethnic minorities (12 of 16) are Democrats. The other four are Republicans:
- Tim Scott of South Carolina is the longest-serving Black senator in history.
- Marco Rubio of Florida – Donald Trump’s pick for secretary of state – and Ted Cruz of Texas are both Hispanic.
- Markwayne Mullin of Oklahoma, a member of the Cherokee nation, is the first Native American to serve in the Senate since Colorado Sen. Ben Nighthorse Campbell retired from the chamber in 2005.
Congress remains far less racially, ethnically diverse than U.S. as a whole
Despite growing racial and ethnic diversity on Capitol Hill, non-Hispanic White people make up a larger share of Congress than of the overall U.S. population (74% vs. 58%). This gap is about as wide as it was in 1981, when 94% of congressional lawmakers were White, compared with 80% of the U.S. population.
In the House, representation of some racial and ethnic groups is now on par with their share of the total U.S. population, while others continue to lag. For example, 14% of House members are Black, the same as the total share of Black Americans. And Native Americans and Alaska Natives now make up about 1% of both the House and the U.S. population. (The U.S. Census Bureau counts Native Americans and Alaska Natives together in its population data, but there are currently no Alaska Natives serving in Congress.)
On the other hand, the share of Hispanic representatives in Congress is much lower than the Hispanic share of the U.S. population (11% vs. 20%). Asian Americans, meanwhile, account for 4% of House members and 6% of the national population.